In the immortal words of Jeffrey Phillip Choate: “Stats are for losers.”
My name is Jesse and I’m a loser here to bring you some stats.
It’s rivalry week in Montana and the anxiety across the state is palpable. Both fanbases are dreaming of visions of dominant victories and dreading the specter of tragic defeats. As both sides attempt to predict what’s going to happen at noon on Saturday in Bozeman, I wanted to take a moment to let the numbers have their say. What follows is my best attempt at pulling the relevant statistics together in an effort to help us get our arms around the most anticipated game of the year. Let me begin by saying a word about…
The Data Set
I pulled these numbers together by isolating MSU and UM’s stats from Big Sky Conference games exclusively. The reason for this is that it makes the sample well and truly comparable; we don’t have to debate the relative value of numbers against Oregon State vs. Nevada or Butler vs. Drake. The Cats and the Griz have played a very similar conference slate, so their numbers from those games are very meaningful for comparison.
So now what do they say? Let’s begin with…
The Great Griz Gap
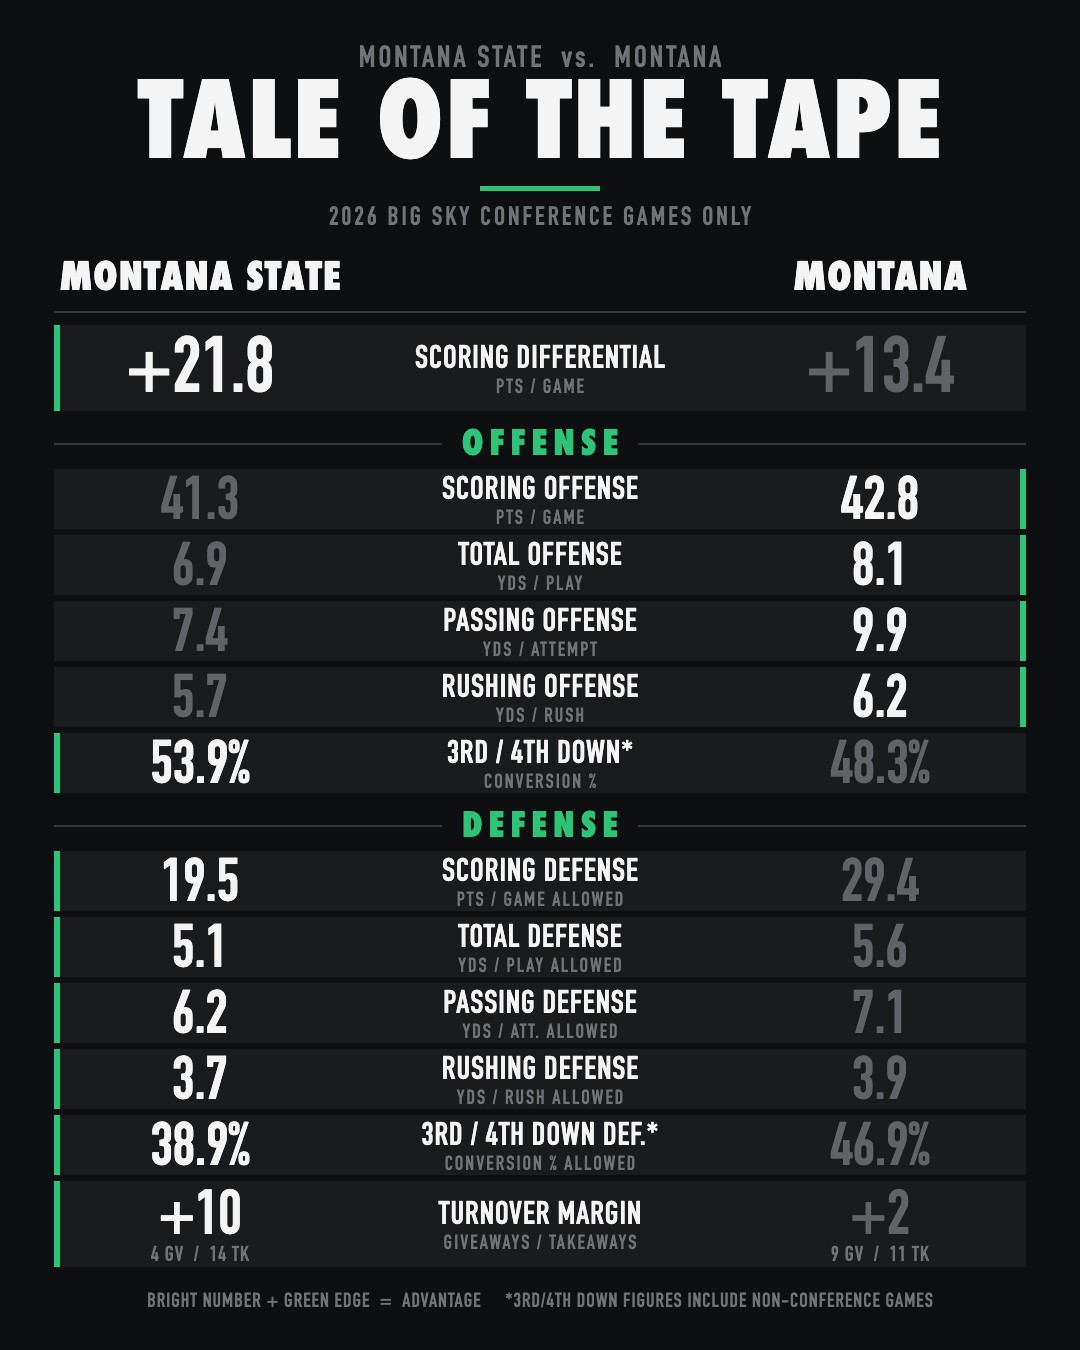
If you’re judging a team’s ability based on how much better they are at gaining yards relative to how many yards they allow, UM is better across the board: in yards per play, per pass, and per rush. MSU, admittedly, has an edge on them in the defensive metrics, but their margins are still considerably worse. For example, the Grizzlies average 8.1 yards per play, while allowing 5.6; that means that on a per play basis, they’re a sterling +2.5 yards better than who they’re playing. The Cats, meanwhile, gain an average of 6.9 yards per play, while allowing 5.1. They’re still well above water, but the margin is smaller at +1.8. This is true overall, in the passing game, and in the rushing game.
So the Griz are clearly the better squad, right? Well, not if you consider…
The Big Bobcat Buffer
When you dig into the stat that actually determines the outcomes of games – points – the Cats have a decisive edge. MSU averages 41.3 points/game, while allowing 19.5, making them +21.8 better than their opponents per contest. The Grizzlies’ offense is super effective, averaging 42.8, but they allow 29.4, putting their margin at +13.4. To be clear, when looking at a points/game stat like this, 8.4 points is a really, really big difference.

So what gives? How could the Grizzlies be that much better at moving the ball relative to their opponents, but still be that much worse than MSU in scoring differential? Here’s my attempt at an answer in ascending order of importance: field position, situational football, and turnovers.
Field Position
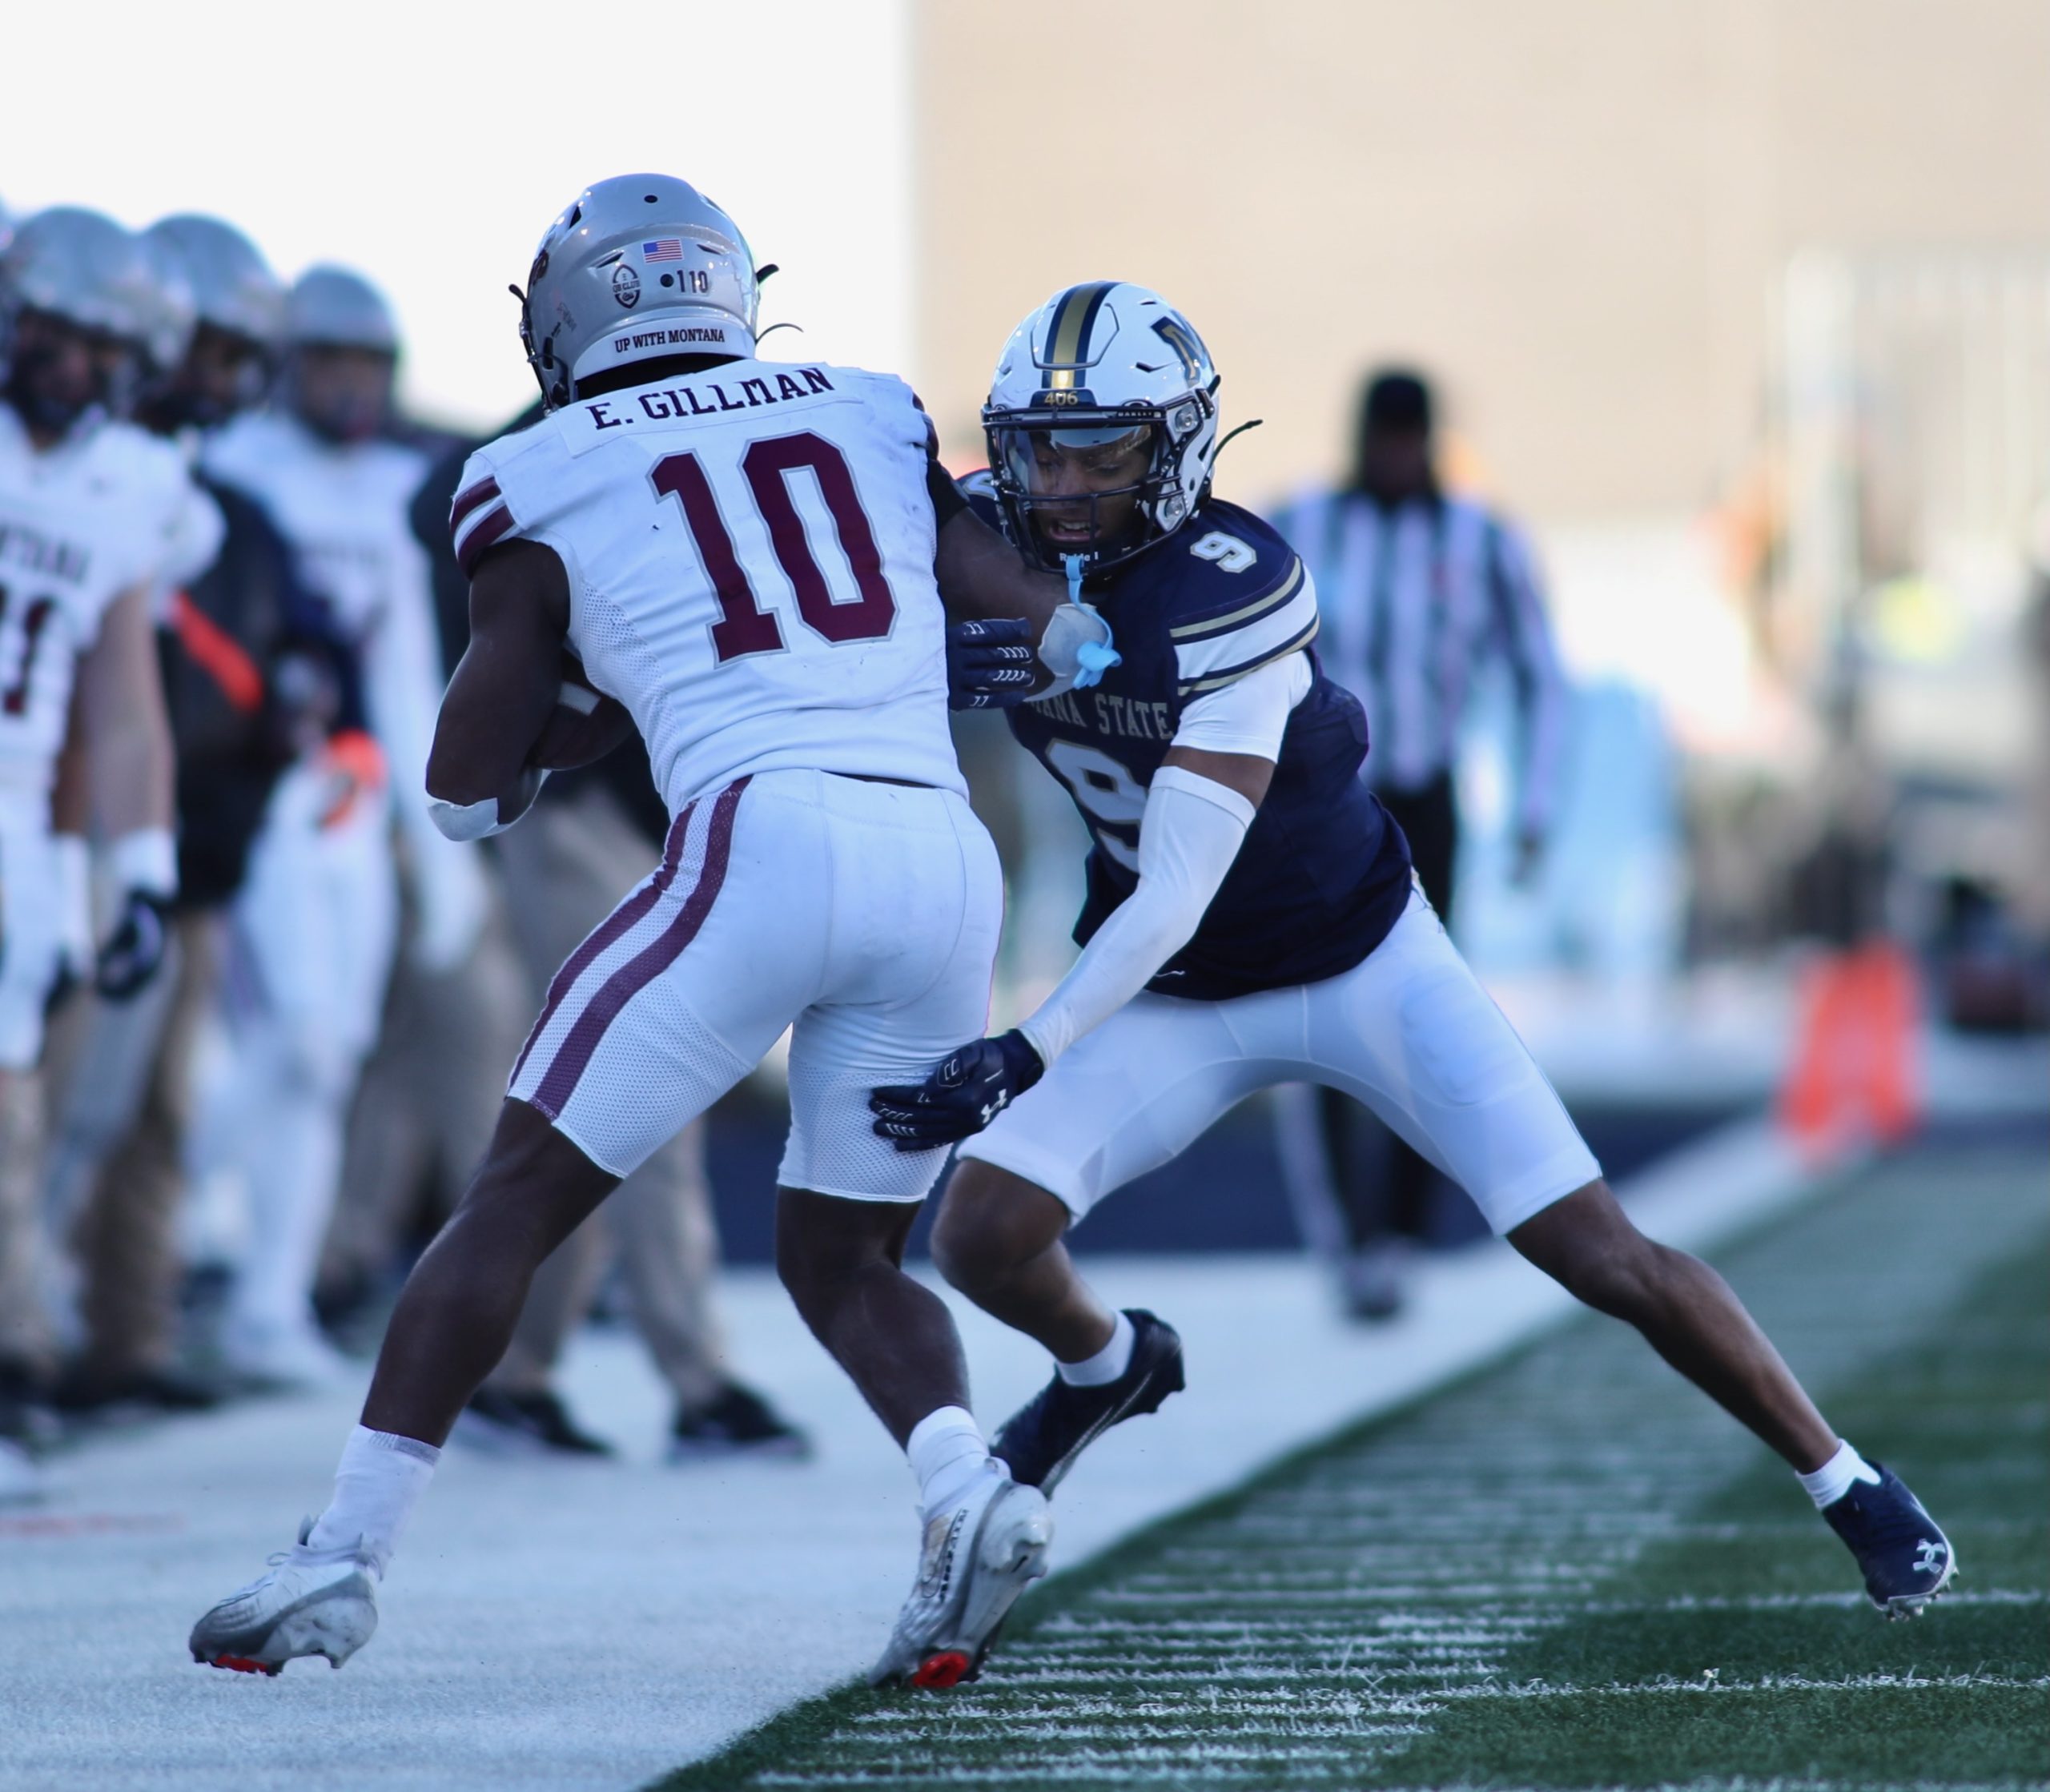
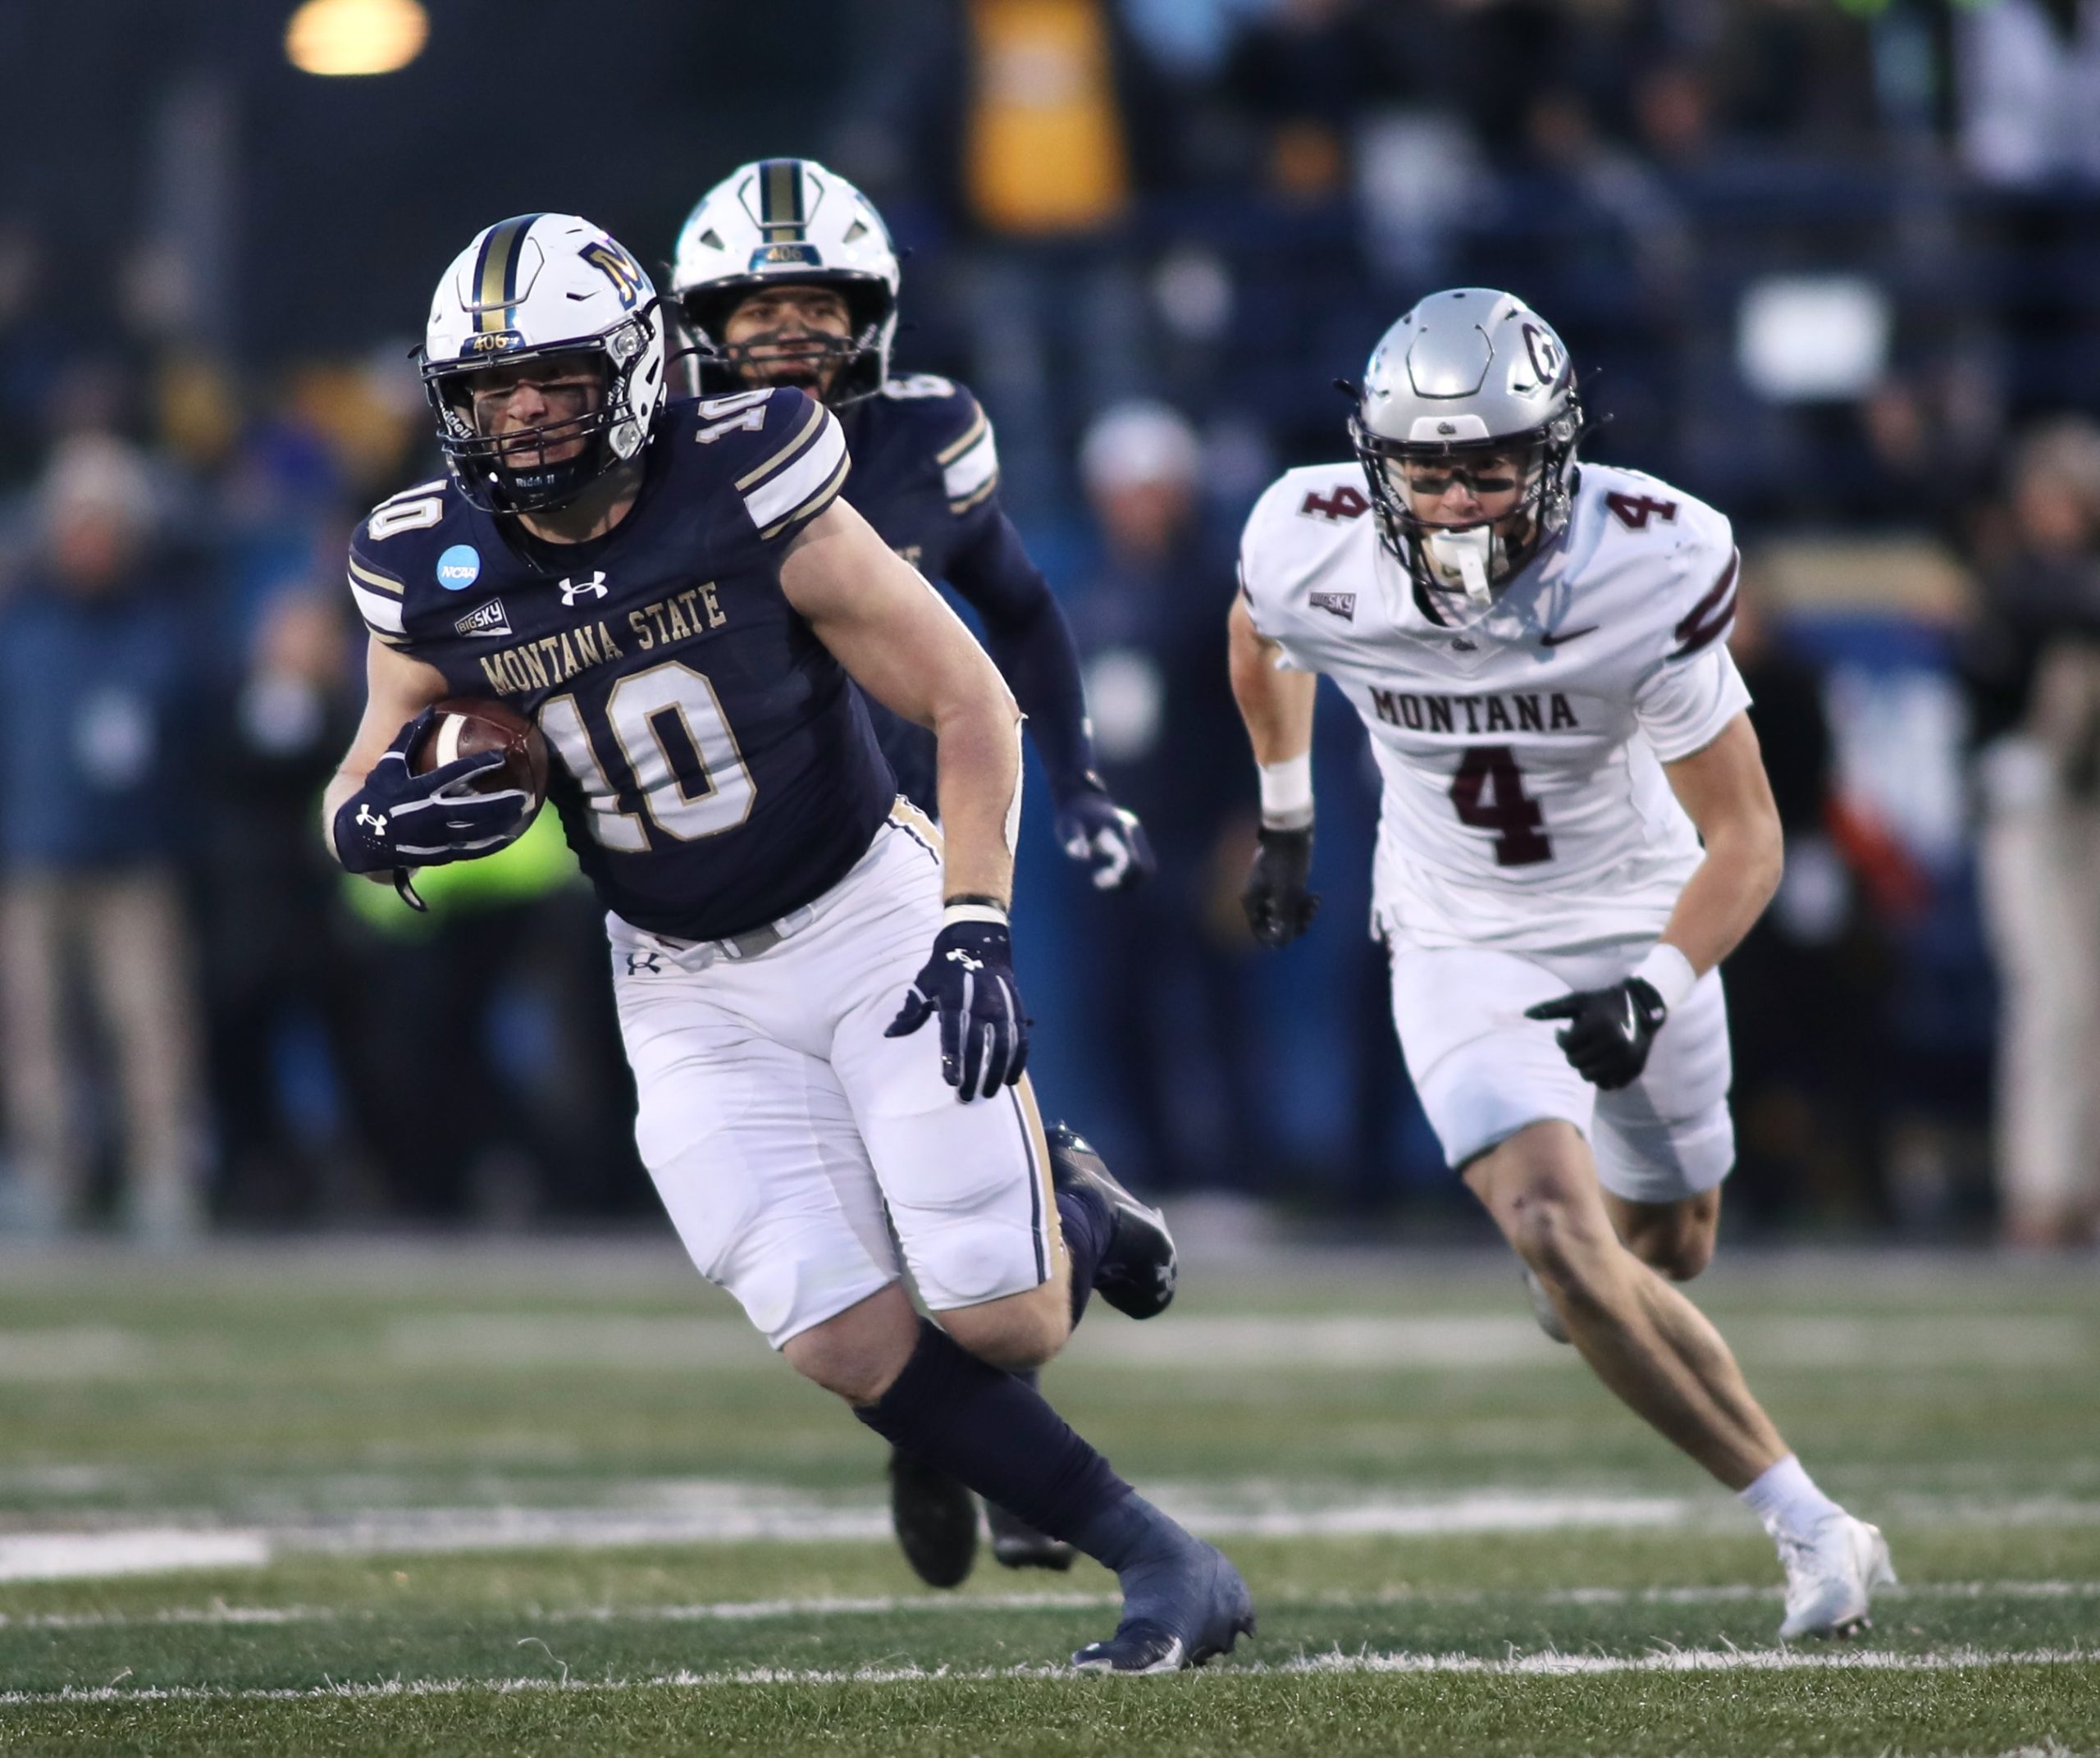
If you dig into the Special Teams numbers for the Cats and the Griz (which I’m sure none of you would ever do, being normal, well-adjusted people), you will find that they are pretty comparable in most regards. There is one big exception: kick returns. MSU is the best in all of the FCS (and second best in all of D1) at 32.1 yards per kick return*. Montana is 40th at 21.6 (and that’s much improved from where they were; they got a big boost from Monte Gillman’s return touchdown on Saturday night). So one reason the Cats score without gaining yardage at the same rate is that they just don’t have as far to go. Adam Jones might rip off a TD run that only goes 54 yards because of where the Cats were on the field, while Eli Gillman goes for 84 yards on a similar play; they both count the same.
Situational Football
Both the Cats and the Griz are really good at converting on 3rd and 4th down. MSU comes in a little stronger at 53.9% to UM’s 48.3%*. But there’s a real gap when it comes to allowing conversions: 38.9% for the Cats and 46.9% for the Griz. What that means is that MSU has created a huge advantage by staying on the field at a much higher rate than their opponents, while the Griz are basically drawing even. The more you avoid punting or settling for field goals while forcing those choices on your opponents, the better off you’re going to be on the scoreboard.
Turnovers
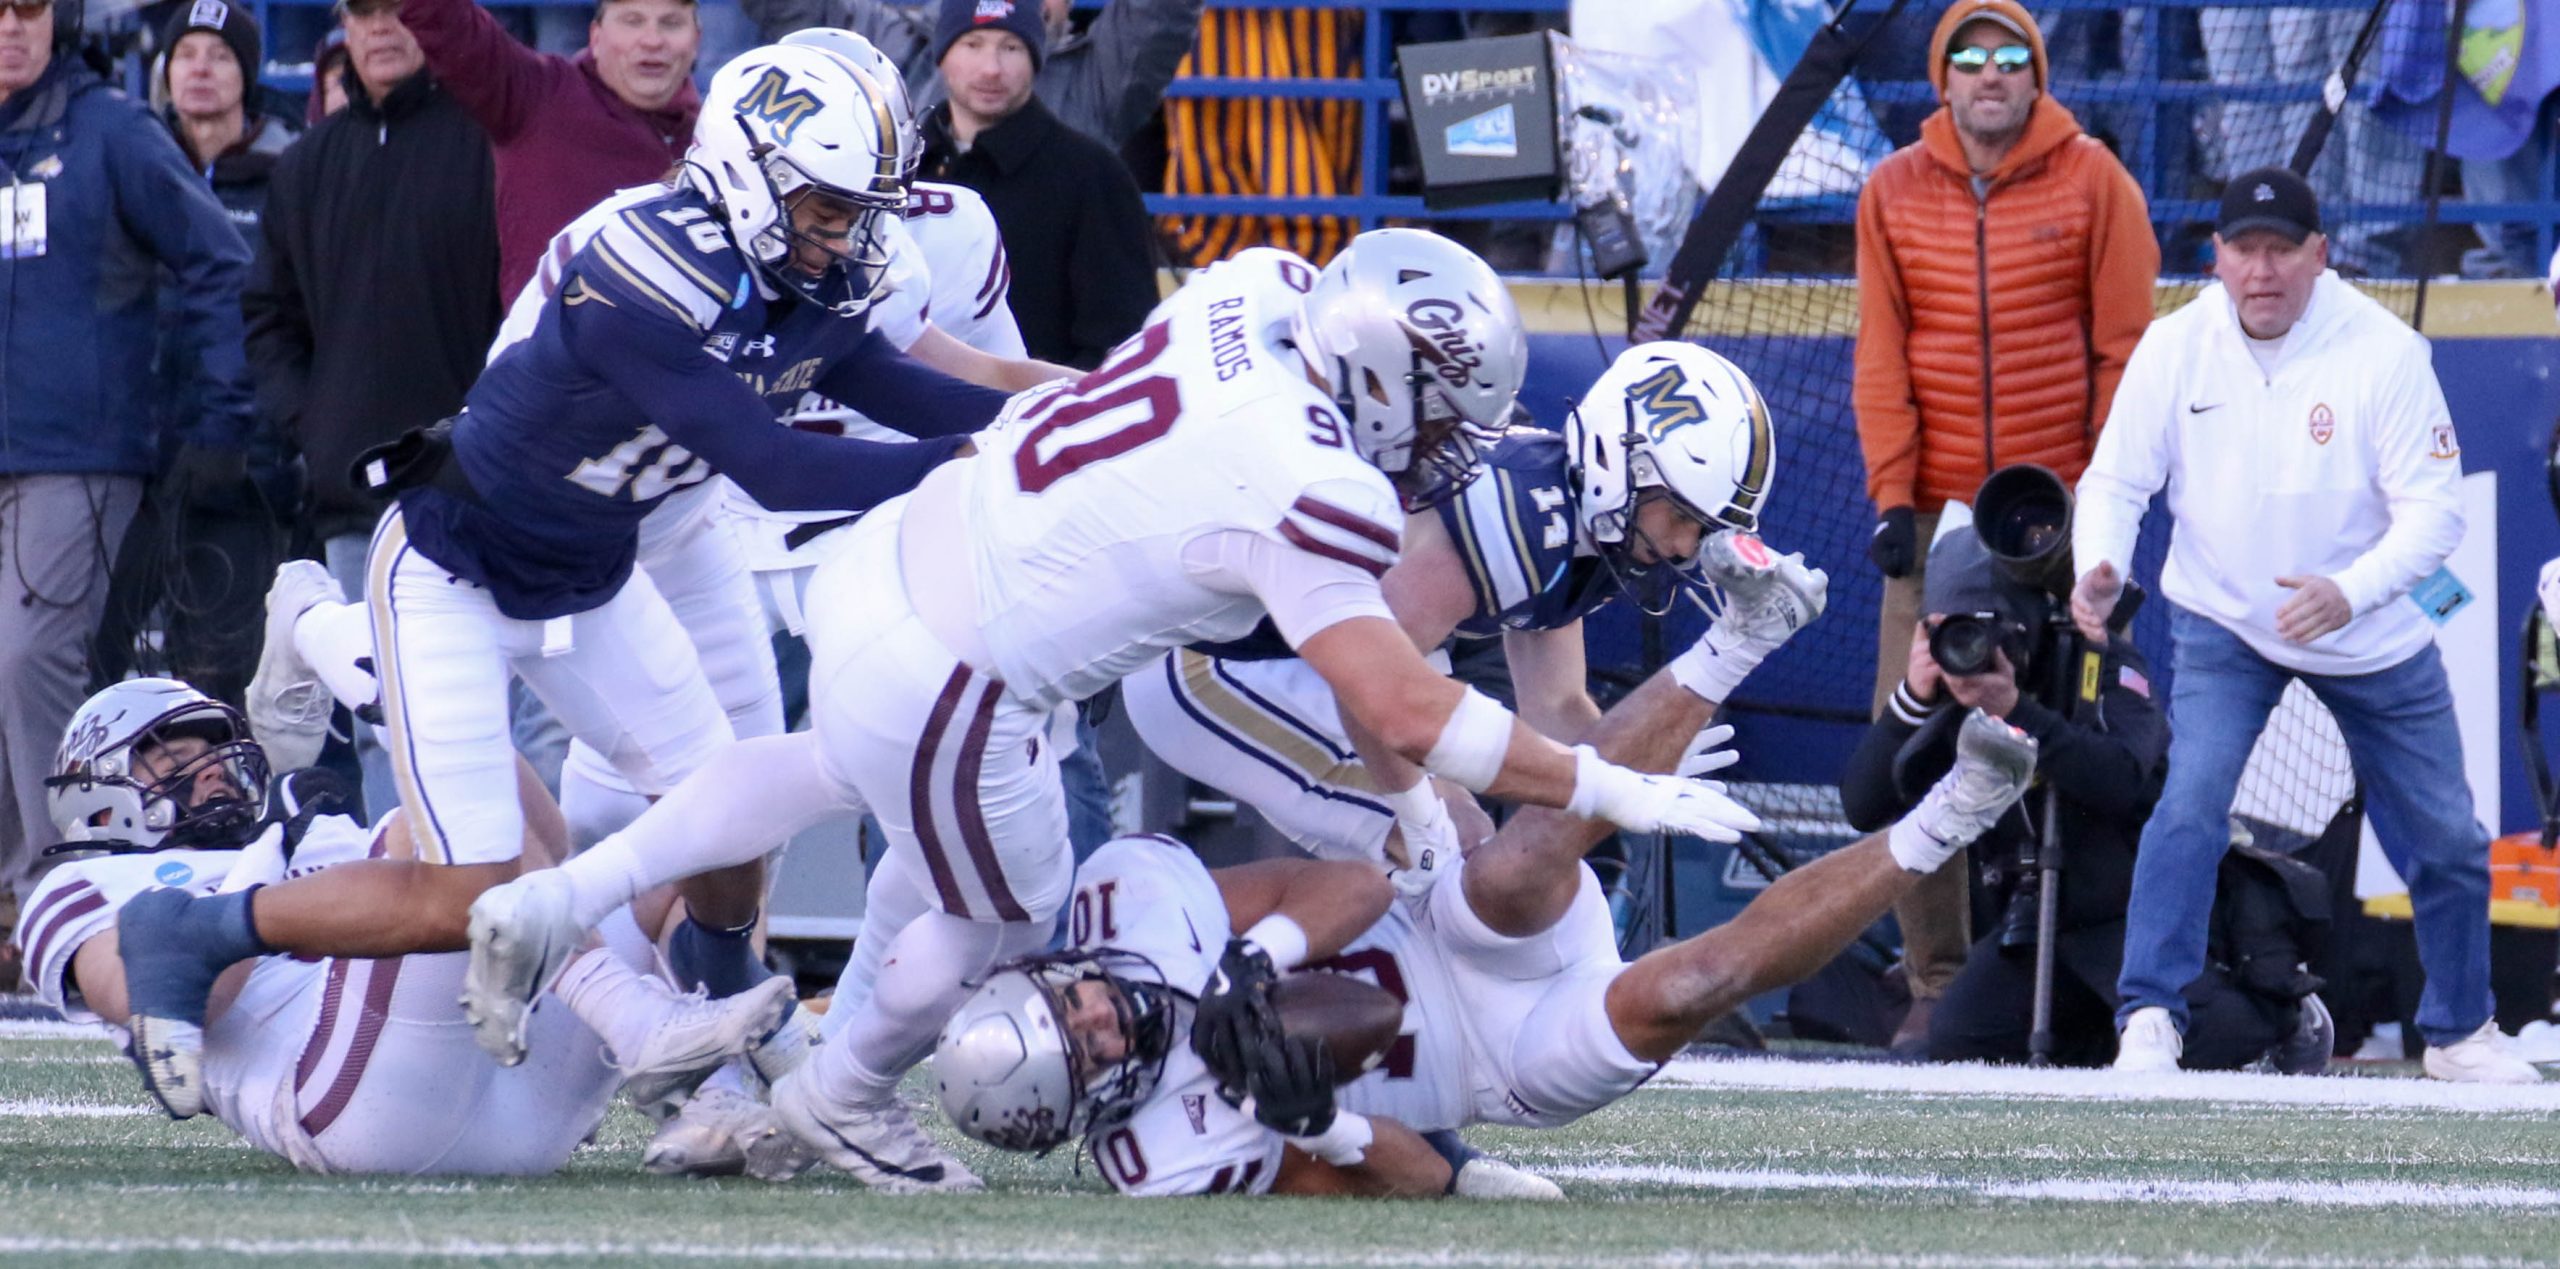
And finally, the big one: turnover margin. The Cats have only given up 4 turnovers and have created 14, making them +10. The Griz are only at +2, having given the ball up 9 times and taken it away 11. Turnovers may be the stat with the single biggest impact on the outcomes of games. One team having a margin five times the size of the other is really impactful.
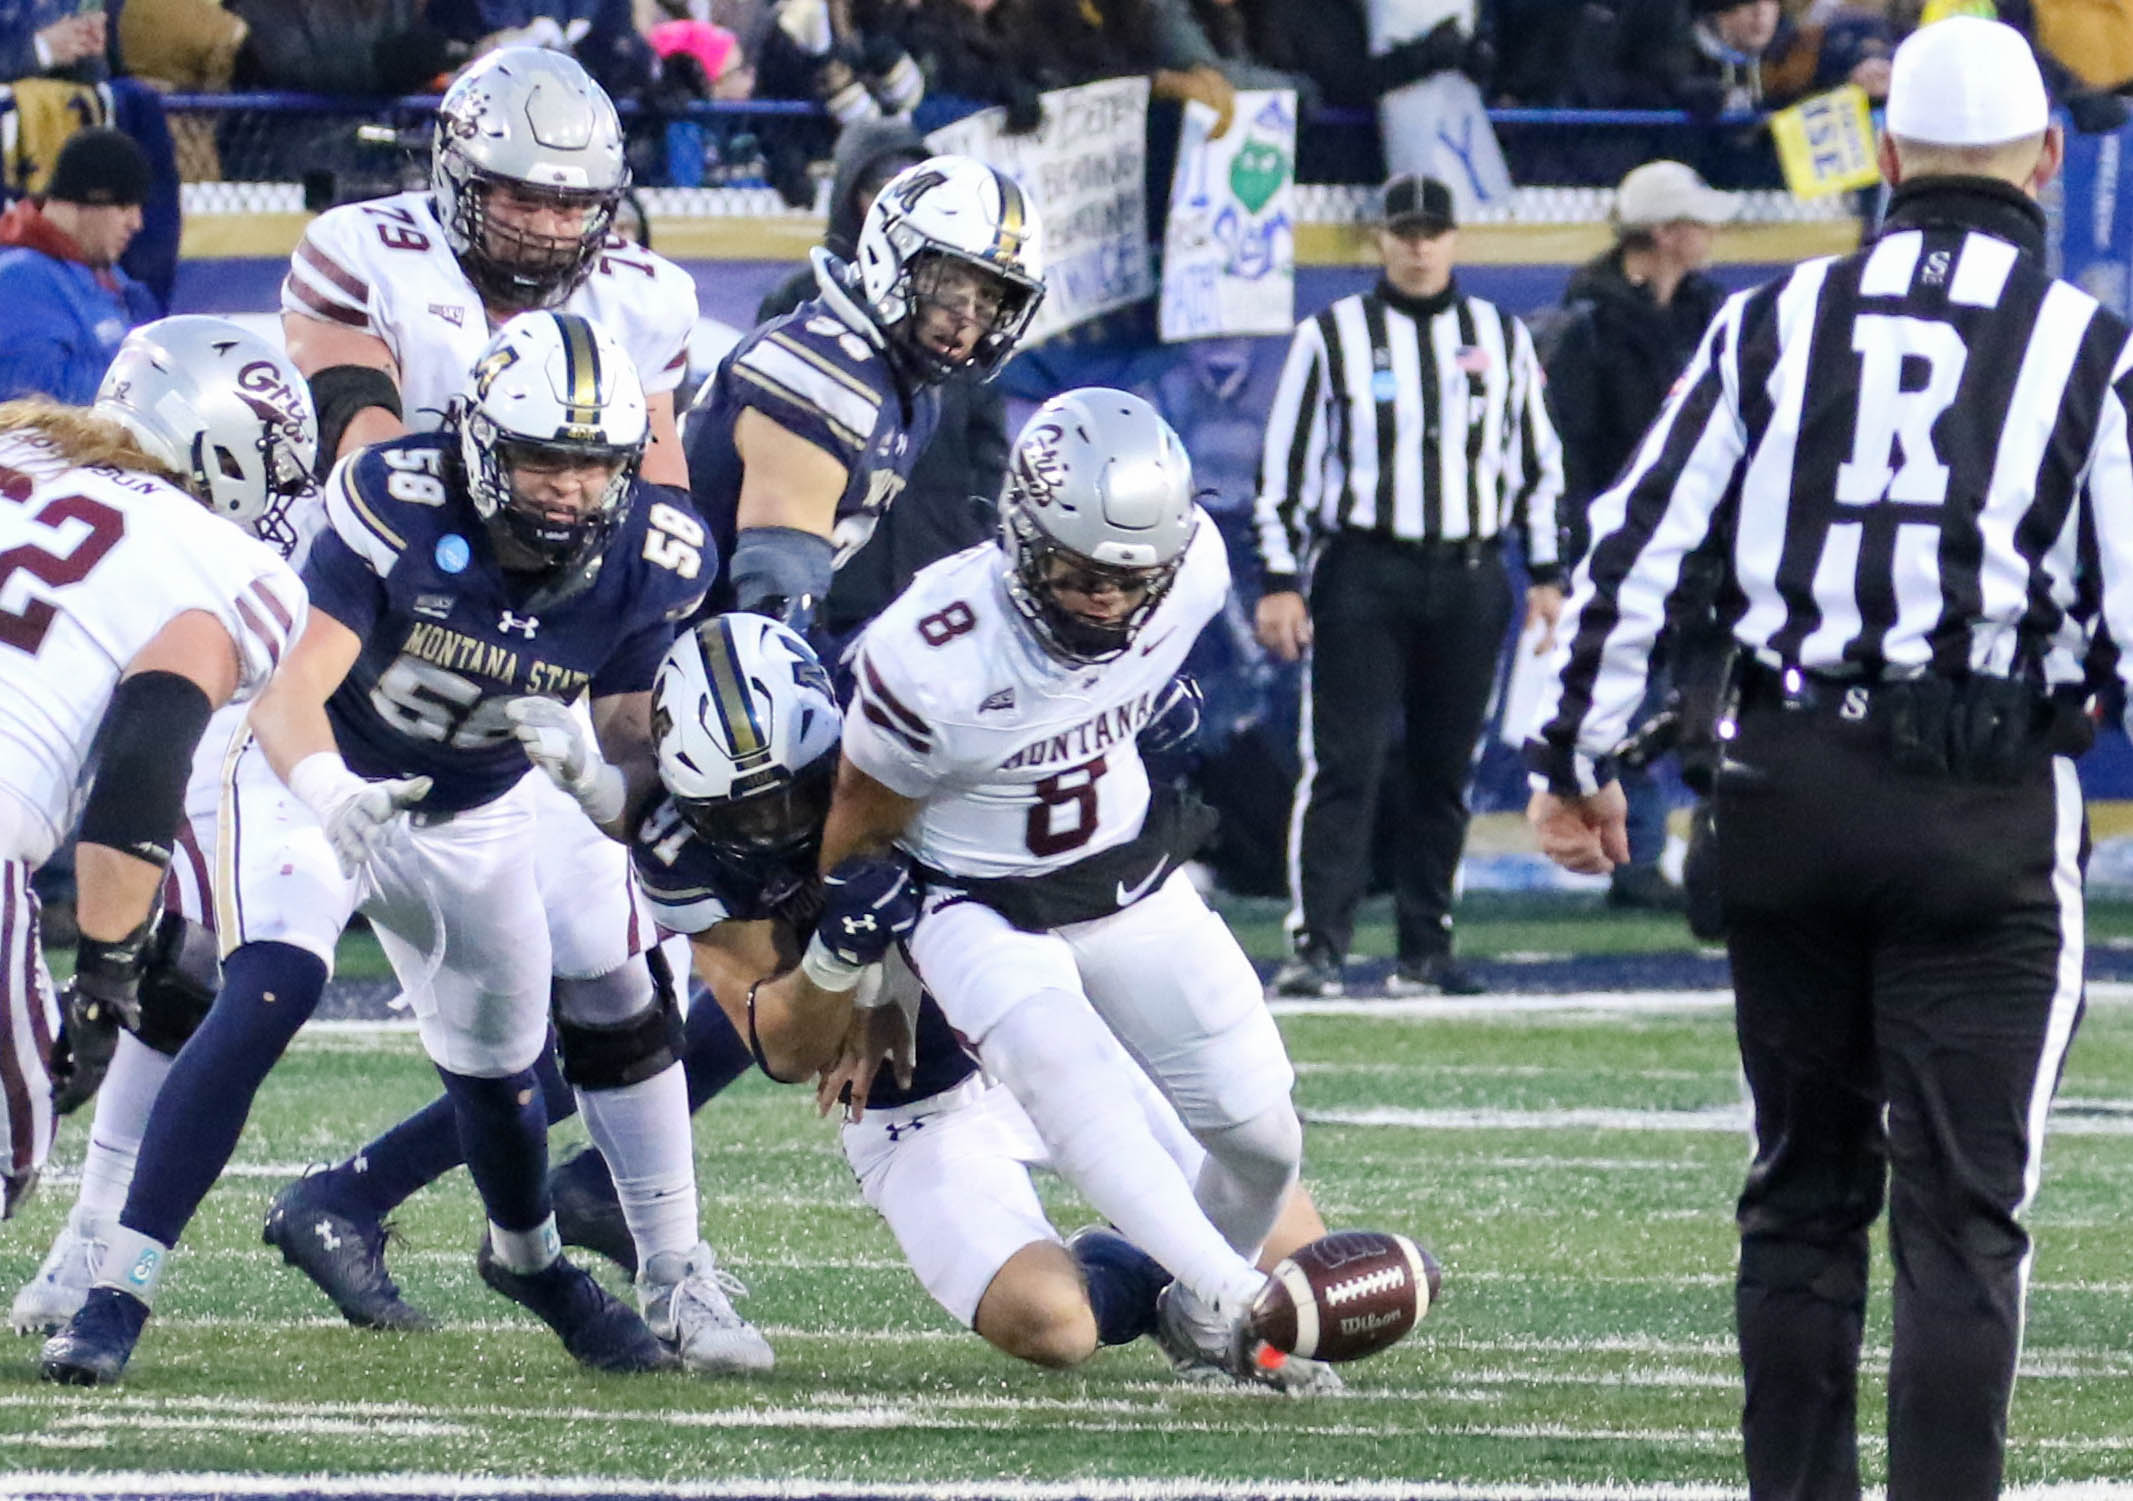
UM’s victory over Idaho State on Saturday night illustrated just how much these factors matter. If the Griz had not returned a kick-off for a touchdown (field position), gotten the ISU offense off the field late (situational football), or returned an endzone interception coast to coast for a touchdown (turnovers), they very well may have lost that game. It remains to be seen how these same factors will show up in the Brawl.
So with all of that said, we’re left with one more number…
The Biggest Number of them All
95.24%. That’s the MSU winning percentage in Bozeman under Brent Vigen since he took over the program in 2021: 40-2. And if you’re only looking at conference games at home? It’s 100%. They lost in overtime to North Dakota State on a blocked extra point and they lost in double overtime on a failed 4th down conversion to South Dakota State. As long as Vigen continues coaching the Cats, it’s a virtual certainty that sooner or later MSU will drop a conference game at home. But the reality remains that his Cats have the best home field advantage in the FCS right now.
Will the Grizzlies and their all-Americans be able to overcome that number on Saturday? We’re all going to find out together.
*For these numbers, I’m using the NCAA stats which includes non-conference games.